

In 2018, the global economic situation is raging and the global trade situation is tightening. The political turmoil in the Eurozone, Brexit and other risk events keeps on the rise. In the context of such international trade situation, despite the negative impact of the international economic downturn, especially the negative impact of US trade policy, have an adverse effect on the China's aerial work machinery and suspended platform/gondola industry, the performance of China's high access Machinery and suspended platform industry is remarkable. Compared with 2017,the export trade has a significant growth and the overall situation of export trade has increased. To the end of December, according to the data statistics of the major manufacturers which use the the HS code 8428.90 for exporting, high access Machinery and suspended platform enterprises earned a foreign exchange of 105.364 million US dollars. The following is the analysis of the export trade of China's major high access Machinery and suspended platform enterprises from January to December in 2018.
1.Monthly exports
First, let's look at the specific situation of the monthly export volume of the high access Machinery industry from January to December in 2018 (see Table 1). From the perspective of time distribution, it maintains a similar trend as in previous years. In February, due to the Chinese New Year holiday, it had the lowest sales in the whole year. The sales in the second half year were higher than in the first half, the highest sales were in August and September. The percentage of amount in the first half year and the second half are respectively 37.54% and 62.46%. The difference between the rates have a slight increase trend year by year. At the same time, the quantity of sales also have the same characteristics. The peak season of sales of high access Machinery and suspended platform enterprises is mainly concentrated in the second half.
| Month | Amount(USD) | Percentage of Amount | Quantity | Percentage of Quantity |
| 201801 | 51007044 | 4.84% | 213811 | 7.70% |
| 201802 | 35573304 | 3.38% | 115544 | 4.16% |
| 201803 | 44246048 | 4.20% | 150086 | 5.41% |
| 201804 | 66670066 | 6.33% | 194119 | 6.99% |
| 201805 | 88689016 | 8.42% | 253554 | 9.13% |
| 201806 | 109339651 | 10.38% | 260079 | 9.37% |
| 201807 | 108564621 | 10.30% | 225193 | 8.11% |
| 201808 | 81684525 | 7.75% | 334884 | 12.06% |
| 201809 | 189534352 | 17.99% | 310844.94 | 11.20% |
| 201810 | 84053867.07 | 7.98% | 206531.06 | 7.44% |
| 201811 | 92930778 | 8.82% | 280230.56 | 10.10% |
| 201812 | 101349595 | 9.62% | 230989.44 | 8.32% |
| Amount | 1053642867 | 100.00% | 2775866 | 100.00% |
Table 1: Monthly total export in 2018
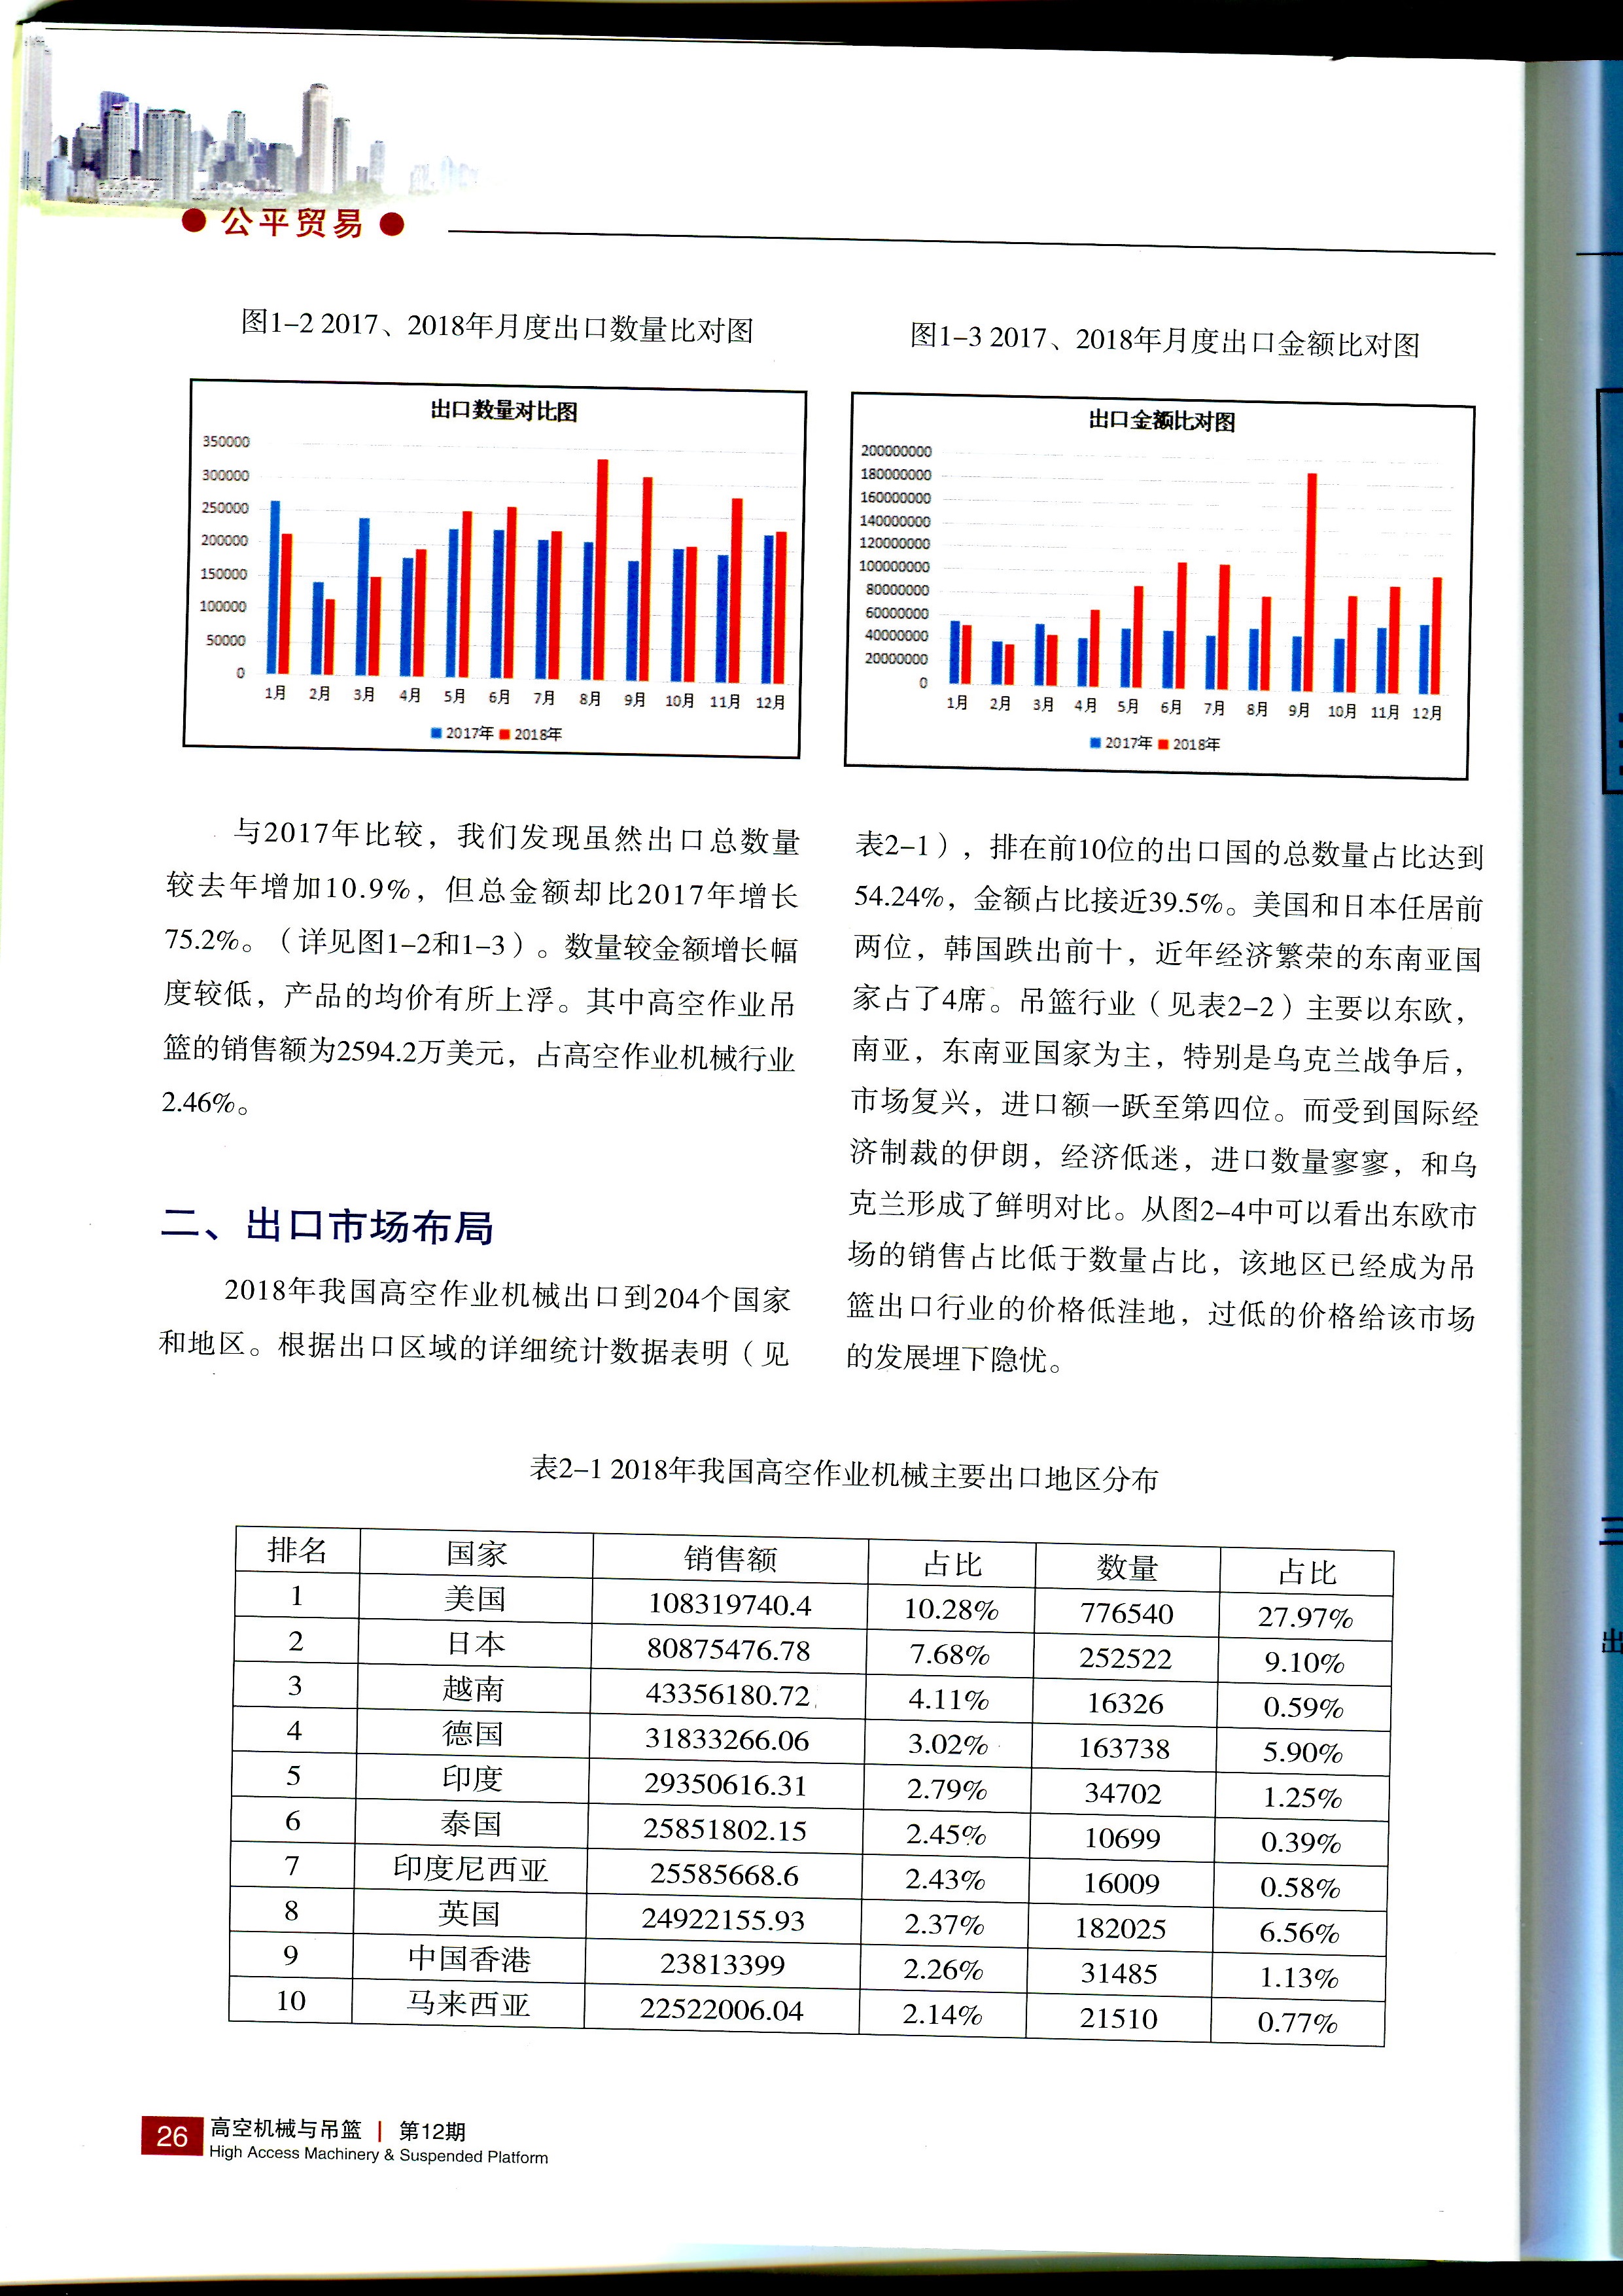
Compared with 2017, we found that although the total export quantity has increased by 10.9%, the total amount of money has increased by 75.2% (See Figure 1 and 2 for details). Above all, the increase of the quantity is lower than the amount of money, so the average price of products has risen. Among them, the sales of suspended platforms was 25.924 million US dollars, accounting for 2.46% of the aerial work machinery industry.
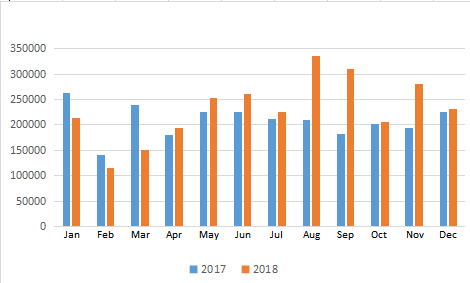
Figure 1: The monthly comparison of export quantity in 2017, 2018
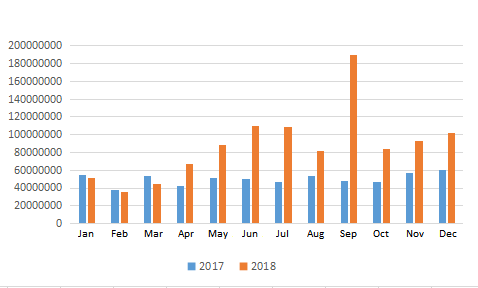
Figure 2: The monthly comparison of export amount in 2017, 2018
2.The layout of export market
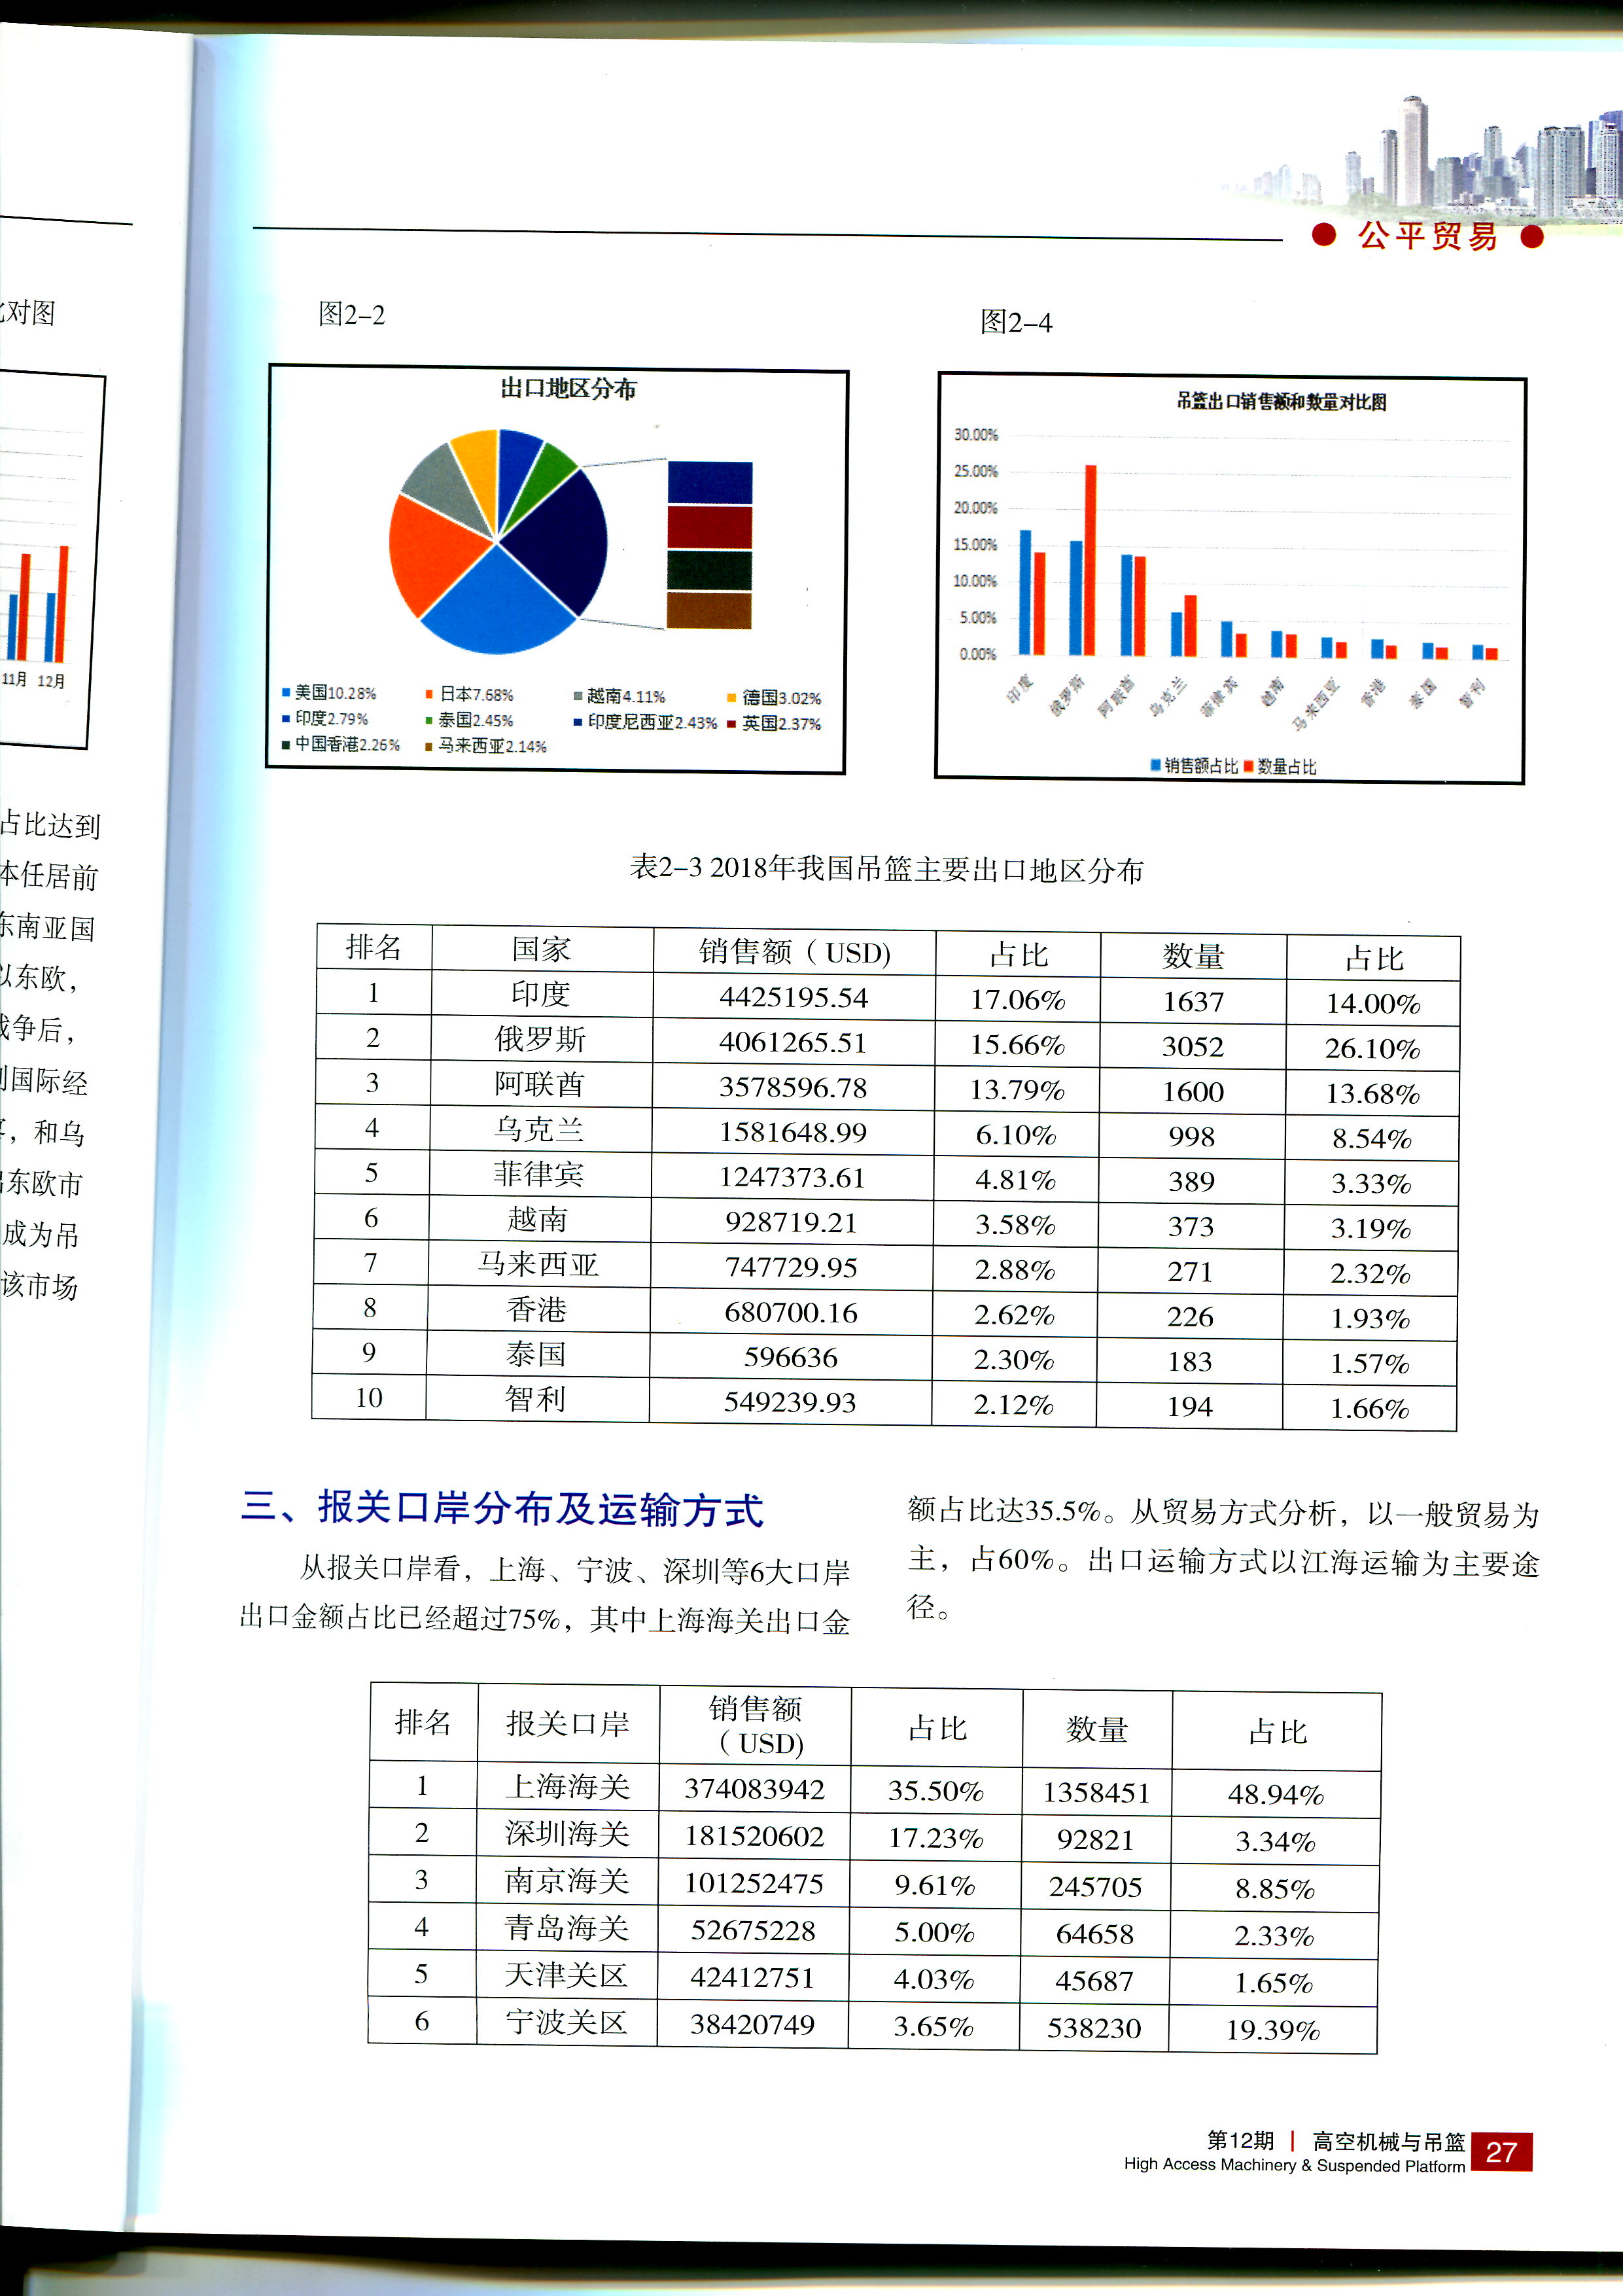
In 2018, China's aerial work machinery was exported to 204 countries and regions. According to the detailed statistics of the export area (see Table 2), the total number of exporting countries ranked in the top 10 accounted for 54.24%, and the amount of money accounted for nearly 39.5%. The United States and Japan are in the top two, South Korea has fallen out of the top ten, and Southeast Asian countries with economic prosperity in recent years accounted for four seats. The suspended platform industry (see Figure 3) is mainly based on the countries in Eastern Europe, South Asia and Southeast Asian. Especially after the Ukrainian war, the market revived and the import volume jumped to the fourth place. Iran, which has been sanctioned by the international economy, has a sluggish economy and a low number of imports, which is in stark contrast to Ukraine. From Figure 4, it can be seen that the sales amount ratio in the Eastern European market is lower than the quantity ratio. The price of the suspended platform export industry in the region has become the lowest, and it has laid a hidden worry for the development of the market.
| Rank | Country | Sales Amount | Percentage | Quantity | Percentage |
| 1 | USA | 108319740.4 | 10.28% | 776540 | 27.97% |
| 2 | Japan | 80875476.78 | 7.68% | 252522 | 9.10% |
| 3 | Vietnam | 43356180.72 | 4.11% | 16326 | 0.59% |
| 4 | Germany | 31833266.06 | 3.02% | 163738 | 5.90% |
| 5 | India | 29350616.31 | 2.79% | 34702 | 1.25% |
| 6 | Thailand | 25851802.15 | 2.45% | 10699 | 0.39% |
| 7 | Indonesia | 25585668.6 | 2.43% | 16009 | 0.58% |
| 8 | England | 24922155.93 | 2.37% | 182025 | 6.56% |
| 9 | Hongkong | 23813399 | 2.26% | 31485 | 1.13% |
| 10 | Malaysia | 22522006.04 | 2.14% | 21510 | 0.77% |
Table 2: Distribution of Chinese main export areas of high access work machinery in 2018
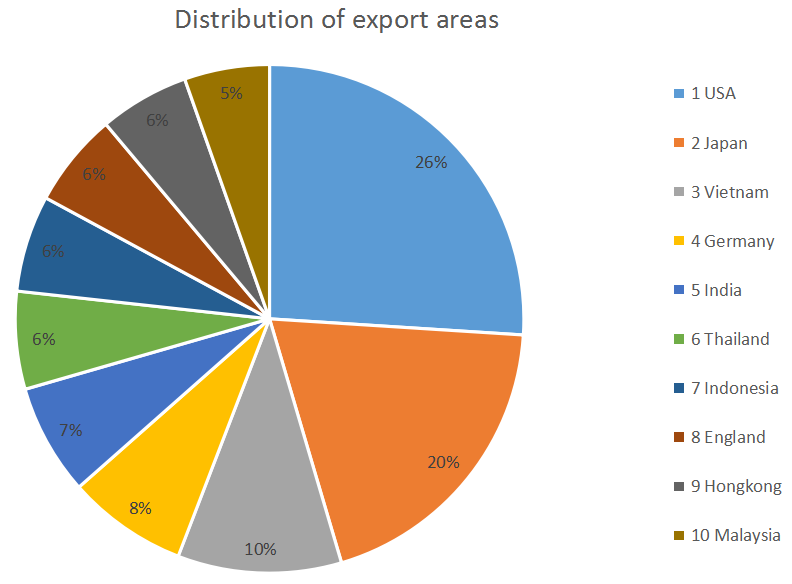
Figure 3
| Rank | Country | Amount(USD) | Percentage | Quantity | Percentage |
| 1 | India | 4425195.54 | 17.06% | 1637 | 14.00% |
| 2 | Russia | 4061265.51 | 15.66% | 3052 | 26.10% |
| 3 | United Arab Emirates | 3578596.78 | 13.79% | 1600 | 13.68% |
| 4 | Ukraine | 1581648.99 | 6.10% | 998 | 8.54% |
| 5 | Philippines | 1247373.61 | 4.81% | 389 | 3.33% |
| 6 | Vietnam | 928719.21 | 3.58% | 373 | 3.19% |
| 7 | Malaysia | 747729.95 | 2.88% | 271 | 2.32% |
| 8 | Hongkong | 680700.16 | 2.62% | 226 | 1.93% |
| 9 | Thailand | 596636 | 2.30% | 183 | 1.57% |
| 10 | Chile | 549239.93 | 2.12% | 194 | 1.66% |
Table 3: Distribution of main export areas of Chinese suspended platform in 2018
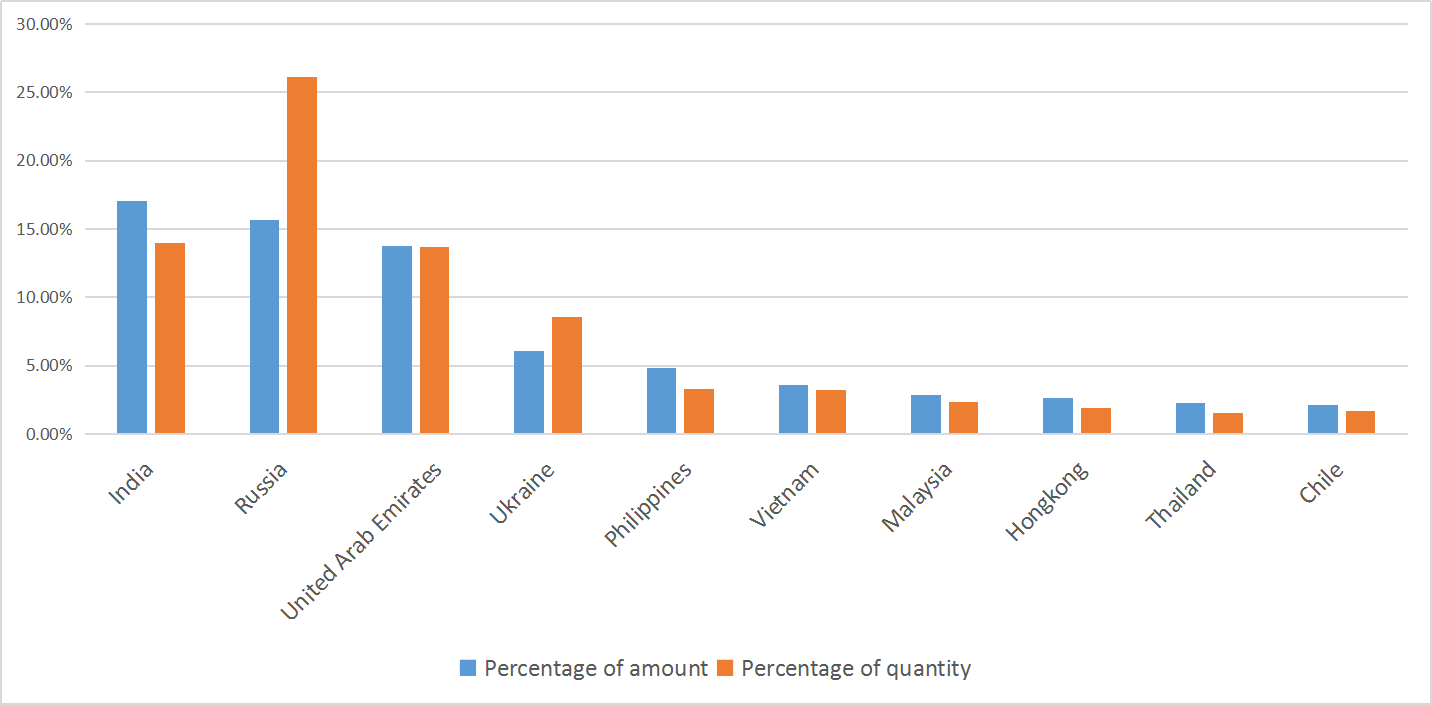
Figure 4: The comparison of sales and quantity of suspended platform’s export
3.The distribution of customs declaration port and transportation methods
From the customs declaration port, the export value of Shanghai, Ningbo, Shenzhen and other six major ports have accounted for more than 75%. Shanghai port has accounted for 35.5%. From the analysis of trade patterns, it is dominated by general trade, which is accounting for 60%. The mode of export transportation is mainly by sea.
| Rank | Customs port | Amount(USD) | Percentage | Quantity | Percentage |
| 1 | Shanghai custom | 374083942 | 35.50% | 1358451 | 48.94% |
| 2 | Shenzhen custom | 181520602 | 17.23% | 92821 | 3.34% |
| 3 | Nanjing custom | 101252475 | 9.61% | 245705 | 8.85% |
| 4 | Qingdao custom | 52675228 | 5.00% | 64658 | 2.33% |
| 5 | Tianjin Customs District | 42412751 | 4.03% | 45687 | 1.65% |
| 6 | Ningbo Guan District | 38420749 | 3.65% | 538230 | 19.39% |
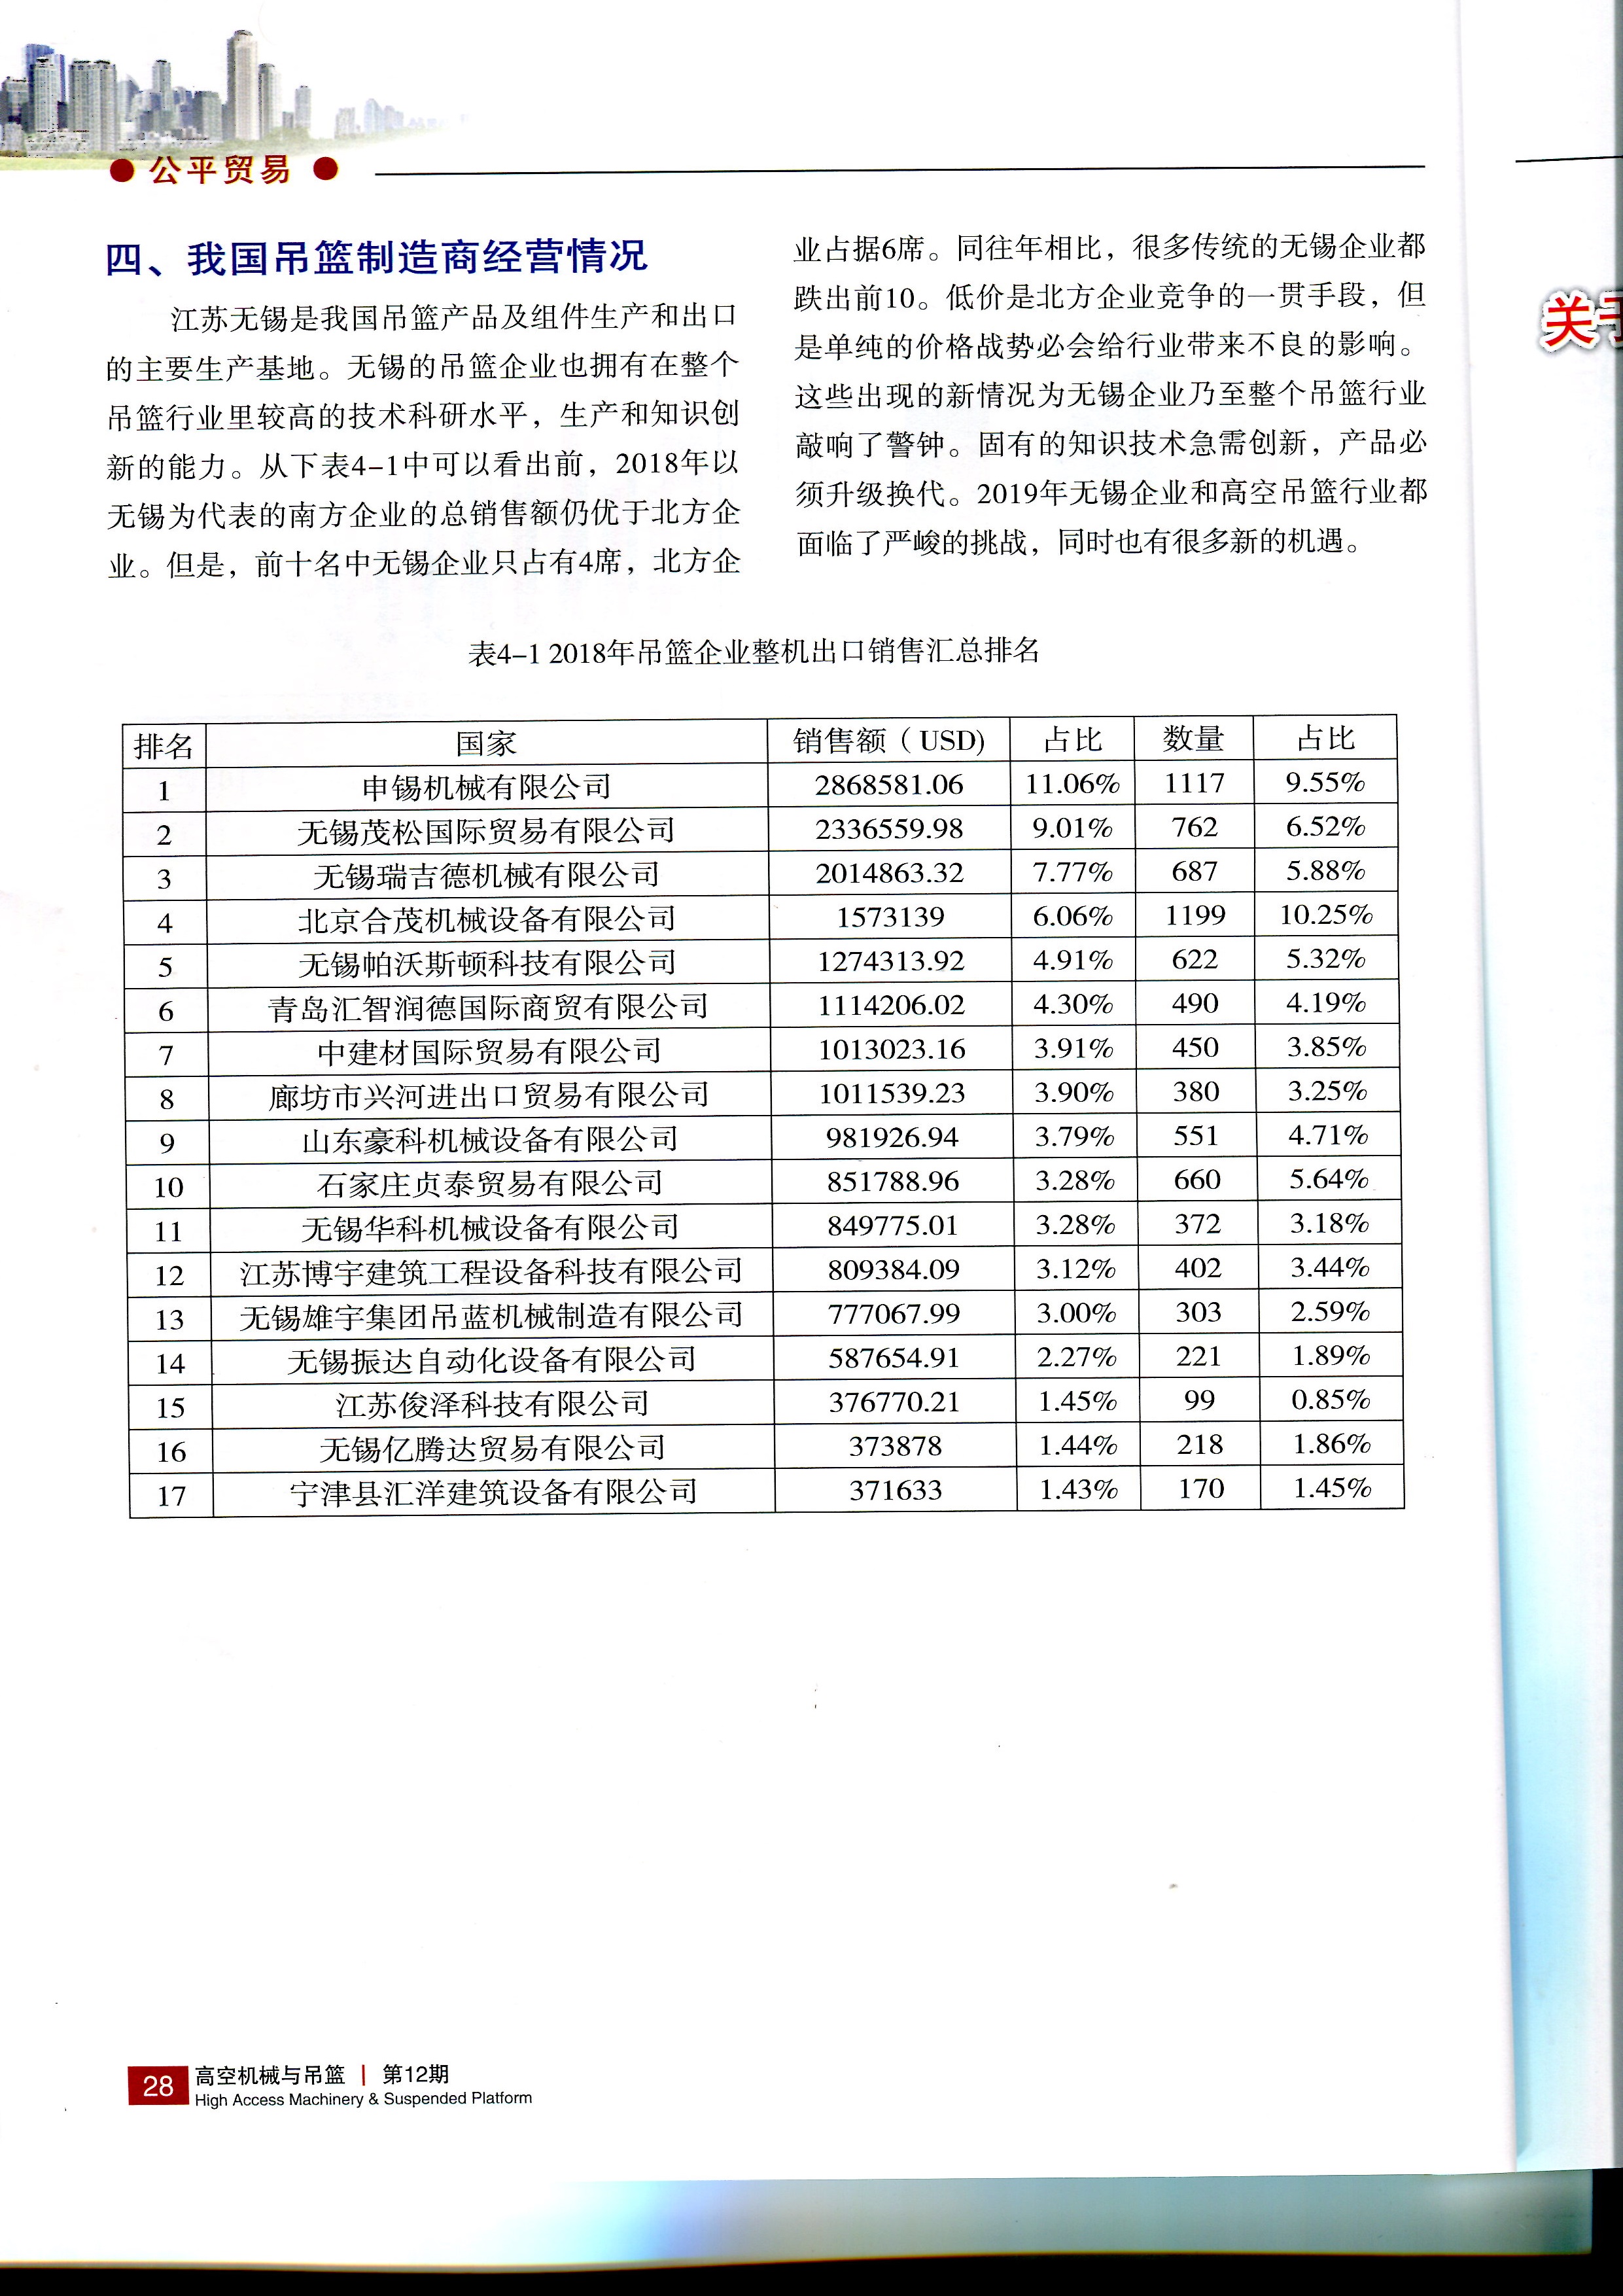
4.The performance and situation of China's suspended platform manufacturers
Wuxi city in Jiangsu Province is the main base for the production and export of suspended platform and its components in China. Wuxi manufacturers of suspended platform also have a complete supply chain, high level of technical research, production and knowledge innovation in the entire industry. In 2018, as Table 4 shows, the total sales amount of southern enterprises represented by Wuxi enterprises are still better than those of northern enterprises. However, Wuxi enterprises only have 4 seats in the top 10, and the northern enterprises occupy 6 seats. Compared with previous years, many traditional Wuxi enterprises have fallen out of the top 10. Low prices are the consistent means of competition for northern enterprises , but price wars will definitely make a negative impact on the industry. The new situation have sounded the alarm for Wuxi enterprises and even the entire suspended platform industry. Inherent knowledge and technology are in urgent need of innovation, and products must be upgraded. In 2019, Wuxi enterprises and high-altitude industry face severe challenges.
| Rank | Company | Amount(USD) | Percentage | Quantity | Percentage |
| 1 | Shenxi Machinery Co.,Ltd. | 2868581.06 | 11.06% | 1117 | 9.55% |
| 2 | Wuxi Maosong International Trade Co., Ltd. | 2336559.98 | 9.01% | 762 | 6.52% |
| 3 | Wuxi Rigid Machinery Co.,Ltd. | 2014863.32 | 7.77% | 687 | 5.88% |
| 4 | Beijing Hemao Machinery Equipment Co., Ltd. | 1573139 | 6.06% | 1199 | 10.25% |
| 5 | Wuxi Powerston Technology Co., Ltd | 1274313.92 | 4.91% | 622 | 5.32% |
Table 4: The TOP5 of 2018 Chinese suspended platform export enterprise
From: Jing. C. The Analysis of the Trade Situation of China's High Access Machinery and suspended platform Industry in 2018 [J]. High Access Machinery & Suspended Platform, 2018: 25-28.